-
Product Management
Software Testing
Technology Consulting
-
Multi-Vendor Marketplace
Online StoreCreate an online store with unique design and features at minimal cost using our MarketAge solutionCustom MarketplaceGet a unique, scalable, and cost-effective online marketplace with minimum time to marketTelemedicine SoftwareGet a cost-efficient, HIPAA-compliant telemedicine solution tailored to your facility's requirementsChat AppGet a customizable chat solution to connect users across multiple apps and platformsCustom Booking SystemImprove your business operations and expand to new markets with our appointment booking solutionVideo ConferencingAdjust our video conferencing solution for your business needsFor EnterpriseScale, automate, and improve business processes in your enterprise with our custom software solutionsFor StartupsTurn your startup ideas into viable, value-driven, and commercially successful software solutions -
-
- Case Studies
- Blog
How to Use Gantt Charts for Software Development
What defines project success? According to the PMBOK guide, it’s all about producing planned deliverables, adhering to budget and time constraints, and implementing approved changes. Sounds pretty clear, right?
However, implementing best practices isn’t that easy. According to PMI’s 2014 report, low-performing organizations complete only 33% of their projects successfully compared to 92% of projects completed successfully by high performers. While there are different top-level issues that cause project failure, the devil is in the details: the most common pain of nearly any project manager is planning and scheduling.

Scheduling helps you keep a project’s workflow organized and meet the final deadline by splitting goals and objectives into milestones. By identifying these milestones, project managers as well as any other stakeholders may track and evaluate progress to forecast and take timely action that leads the project to success. But how can you plan each project stage efficiently?
Referring back to the PMBOK, we suggest that one of the most useful tools for project management and planning is the Gantt chart. A Gantt chart is a visual representation of a project’s schedule that allows you to track its status.
How to Create a Gantt Chart
Before creating a Gantt chart you need to collect all the necessary information. That is, you need to know all the processes within projects as well as deadlines, milestones, and dependencies for each task. Once you’ve collected this information, it’s time to map it.

To do that you can either use software like Matchware or Microsoft Project, draw a chart using Microsoft Excel or Apple Numbers, or even use the paper and pencil. Here we’re going to focus on the theoretical approach of the Gantt chart.
On a Gantt chart, the horizontal axis usually represents time. Depending on the speed of your project and the tasks to be done, you can break time into days, weeks, or even quarters. The vertical axis represents tasks or milestones. At this point your chart should look something like this:

Now it's time to fill the middle of the chart with bars representing tasks and their expected durations. Gantt charts allow for different relationships between tasks, the most important being
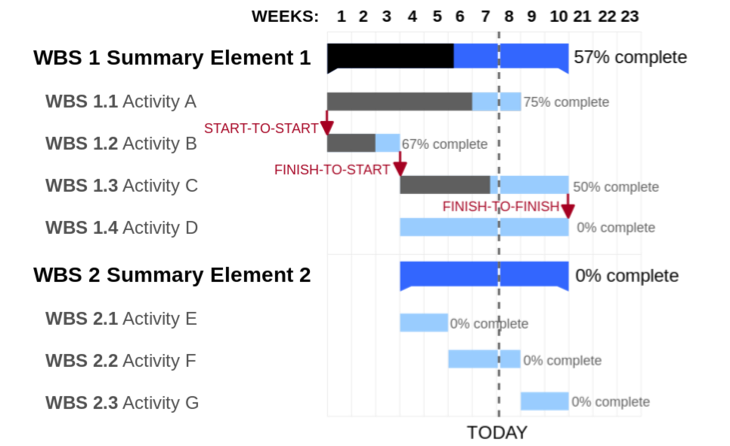
- Finish to Start, when a task can start only when a previous task has been completed.
- Start to Start, when a task can start only when another task starts.
- Finish to Finish, when a task can end only after a preceding task has ended.
Gantt charts may visualize other relationships as well; however, the ones we’ve mentioned are the most common.
Here’s another simple representation of a Gantt chart:

Some Tips for Using Gantt Charts
Most companies find it useful to add more functionality to Gantt charts. Here are a few pieces of advice if you’re already using Gantt charts:
- Use colors to represent tasks for different teams or team members or to visualize different task statuses.
- Turn taskbars into task progress bars.
- Have a TODAY line to quickly see the project’s current state.
- Find critical tasks and show their dependencies with additional arrows.
- Add milestone markers if your project has major events requiring a large part of work to be finished before anything else can be done.
- Check out the functionality of your software – you might find features that help you reach your goals – for instance, dynamic layers can help you quickly switch between planned and actual progress.
How to Use Gantt charts for Development Projects
Gantt charts are a pretty convenient and efficient way for teams to schedule, track, and report their project workflows. What’s the most useful way to implement this tool with IT teams? Consider the three following scenarios for using Gantt charts for development projects.
Sprint Tracking
Since sprints in Agile projects are short milestones, Gantt charts allow you to track work progress and task completion effectively and visually.

Gantt charts also let create groups of tasks and dependencies between them, change requests, and note how much time each task takes. Real-time updating and clear visibility make Gantt charts a convenient and helpful tool for tracking sprints.
Collaboration
This tool may also serve as a platform for team planning. For instance, if a developer is engaged in several projects at a time, a Gantt chart is a convenient collaboration tool. Along with tracking each team member’s progress, it’s also possible to attach files, add comments or notes, and mark task completeness.

Timesheet Integration
Another great way to work with Gantt charts is to integrate them with timesheets. Since time is one of the most critical metrics in the project management context, combining time records with a Gantt chart may provide you with an even more powerful tool. This approach helps you monitor the time worked by each team member as well as determine project stages or tasks that need more resources.
Additionally, Gantt charts are a useful tool for completing the following tasks:
- Breaking projects into small and easy-to-do tasks.
- Scheduling the work of all team members, helping them stay organized and effective throughout the project lifecycle.
- Finding new and creative ideas to optimize the process via brainstorming.
- Setting accurate deadlines.
- Seeing project dependencies so team members can better communicate.
- Monitoring project progress and quickly adapting to sudden changes.
We’re pretty sure you’ll find your own way to take advantage of Gantt charts, whether it’s for scheduling, tracking progress, collaborating or visualizing task dependencies. If you’re searching for more guidance regarding project management, let’s start a discussion on Twitter!


